Why Vacancy, Overtime and Absence Have to Be Read Together
Three systems, three owners, three meetings. The pattern is only visible on one screen.
6 min read
By Rob Howie, Founder & CEO · Senzo · September 2026
Quick Answer
Vacancy, overtime, absence and staff flows are four measurements of one thing: the pressure on a unit. Read separately, each stays within tolerance while the unit deteriorates. Read together at unit and provider-type level, over the same weeks, they show the sequence that precedes a staffing crisis (absence up, overtime up, exits up, vacancy last) while there is still time to act. No new data is required; the join is what is missing.
Key Takeaways
- In most health systems vacancy belongs to HR, overtime to finance and absence to scheduling; each report is accurate and none tells the story
- The pattern that precedes a crisis runs absence, overtime, outflow, vacancy, over roughly a quarter; vacancy is the last to move
- The fix is a join, not a new dataset: one definition set, one unit and provider-type map, refreshed as extracts arrive
Ask a health system for its workforce numbers and you will get three reports. HR sends vacancy by department. Finance sends overtime by cost centre. The scheduling office, or the payroll team, sends absence by pay period. Each is produced by competent people from a system of record. Each is accurate.
None of them tells the story, because the story is not in any one of them. It is in the relationship between them, for one unit, over the same stretch of weeks. And nobody is paid to read that.
What are the four workforce streams?
Four measurements describe the pressure on a unit. Vacancy: positions and FTE the unit is funded for and does not have. Overtime: hours worked beyond what was scheduled. Absence: unplanned hours away from scheduled work. Flows: the headcount or FTE arriving and leaving. They are different lenses on the same thing, and in almost every health system they are held by different owners, defined differently, and refreshed on different cycles.
That separation is not a failure of any one team. It is how the systems were bought. The HRIS was bought for positions and people. The scheduling system was bought for shifts. Payroll was bought for pay. Each does its job. The planning question sits in the gap between them.
Why can't each metric be read on its own?
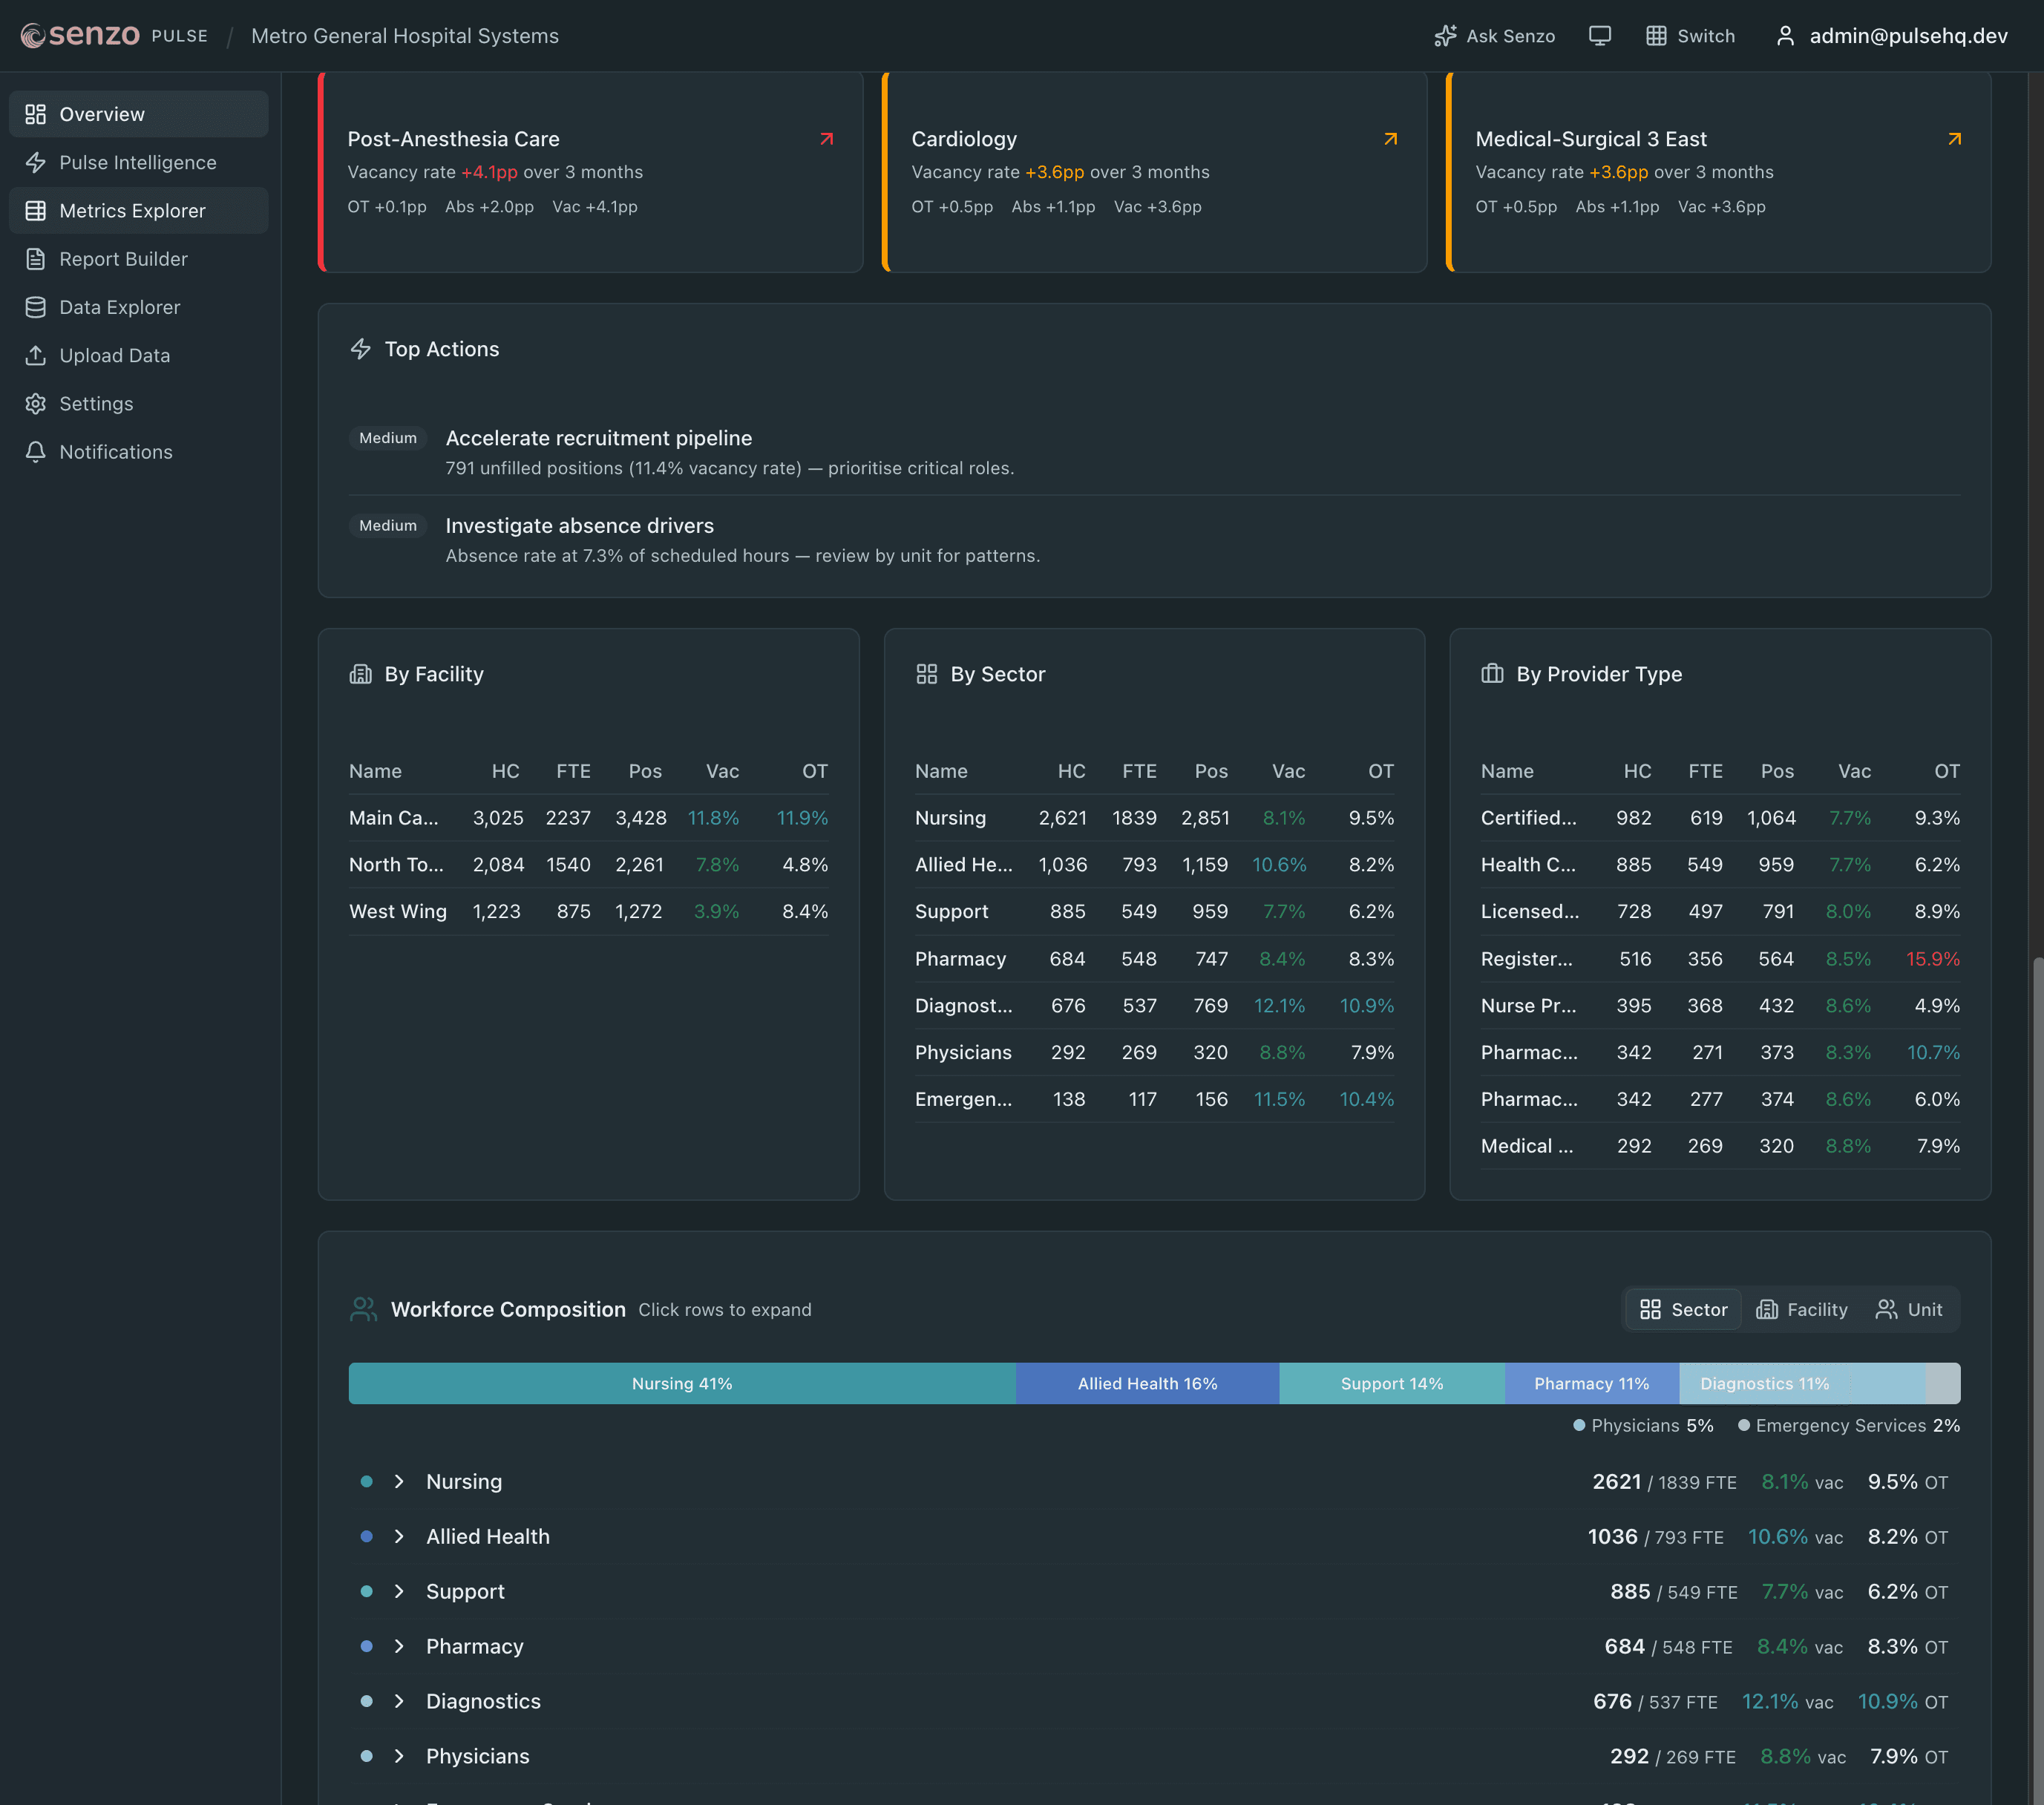
Because each one is inside its tolerance more often than the unit is healthy. Consider a medical unit over one quarter. Absence rises from 5% of scheduled hours to 7%. Overtime rises from 4% to 7%. Two people resign. Vacancy moves from 6% to 8%.
In three separate reports, that is three modest movements, each of which has a reasonable explanation on its own: a bad flu month, a few open shifts, normal turnover. In one report for one unit, it is the sequence that precedes a staffing crisis, already a quarter old.
What does the pattern look like?
It runs in an order, and the order is the point.
Absence moves first. Sustained unplanned absence is workforce stress showing up in the only channel staff control. A rise that holds for six to twelve weeks in one unit is not a flu season.
Overtime follows. The absent hours have to be covered, and the fastest cover is the people who are still there. Overtime concentrates in the unit, and in a subset of the provider types in it.
Outflow follows overtime. The people carrying the overtime are the ones most likely to leave. Exits show up in HR data as resignations weeks before they show up anywhere else.
Vacancy moves last. A position becomes vacant after the exit is processed, and the vacancy rate moves after the position is counted. It is the number everyone watches and the last one to change. That is what makes it a lagging indicator.
What grain does the data need to be at?
Unit and provider type. A system-wide nursing vacancy rate of 9% can contain an ICU at 22% and a surgical floor at 3%; the average is where the signal goes to die. Within a unit, one provider type can be in crisis while the unit total looks fine, because the other provider types are not.
The period matters less than people think. Weekly or per pay period is enough to see a trend form; daily is better but not required. What is required is that all four streams are at the same grain and cover the same weeks, so the sequence can be seen.
Do you need new data?
No. Every health system already produces all four streams. What is missing is the join.
The join fails on three things. Definitions: is an FTE contracted, paid or worked; does turnover count internal transfers; is a vacancy a posted position or a funded one. The unit map: HR, payroll and scheduling each name the same unit differently, and the crosswalk between them is usually one analyst's spreadsheet. Refresh: a join done by hand once a quarter shows the pattern a quarter late, which is the same as not seeing it.
Fix the definitions once, build the crosswalk once, and refresh as extracts arrive, and the four reports become one picture. That is not a modelling problem. It is an operating discipline, and most systems have never had a reason to build it until a ratio mandate, an auditor or a new tower makes the question urgent.
What Senzo does with this
Senzo Pulse is the join, built once and kept current: the four streams from a health system's own extracts, mapped to one definition set at unit and provider-type level, refreshed as data arrives, with the pattern above surfaced in plain language before vacancy moves. It is in build, with three design-partner places open for publicly funded health systems. The programme page has the details.
Frequently asked questions
What are the four workforce streams?
Vacancy (positions and FTE unfilled), overtime (hours worked beyond scheduled), absence (unplanned hours away from scheduled work), and staff flows (inflow and outflow of headcount or FTE). Each is a different lens on the same unit, and each is usually held by a different department.
Why can't each metric be read on its own?
Because each one is within tolerance more often than the unit is healthy. A modest rise in absence, a modest rise in overtime and a modest rise in exits are three green lights in three reports and one red light in reality. The pattern is only visible when the streams sit side by side for the same unit over the same weeks.
What does the pattern that precedes a staffing crisis look like?
Absence rises first and stays up for six to twelve weeks. Overtime climbs to cover it. Outflow follows as the people covering the overtime leave. Vacancy moves last, after the exits are processed. By the time vacancy moves, the unit has usually been under pressure for a quarter.
What grain does the data need to be at?
Unit and provider type, at the period the source systems already report (weekly or per pay period is enough; daily is better). System-wide averages hide the units that need attention, and a single provider type can be in crisis inside a unit whose total looks fine.
Do health systems need new data to do this?
No. Every health system already produces the four streams. What is missing is the join: one set of definitions, one unit and provider-type map across HR, payroll and scheduling extracts, and a refresh that happens as data arrives rather than once a quarter by hand.